
Results of 2017-2018 Completer Survey from Skyfactor
Results of 2017-2018 Completer Survey from Skyfactor Satisfaction of completers (Component 4.4 | A.4.2)Major Indicators of Performance
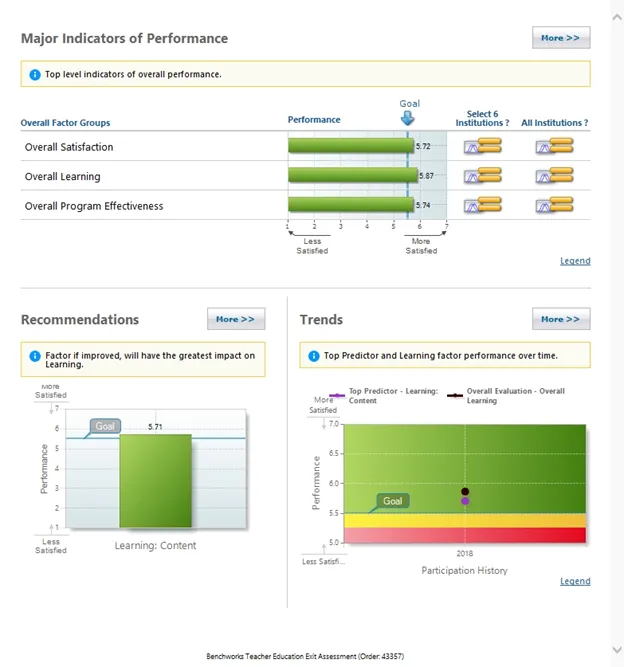
Our university has a higher mean than the goal 5.5 for overall satisfaction, learning and program effectiveness. There is no statistical difference between our scores and our peer 6 institutions (Old Dominion University, University of Missouri-St. Louis, SUNY at Old Westbury, University of Tennessee at Martin, University of Kansas and University of Wisconsin-Stout).
Recommendations
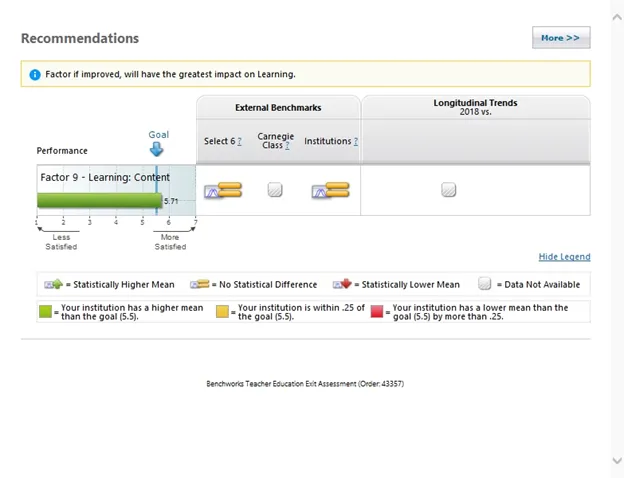
We reached our goal for Learning: Content, which we know has a great impact on candidate learning, we are exploring ways to improve in this area.
Trends
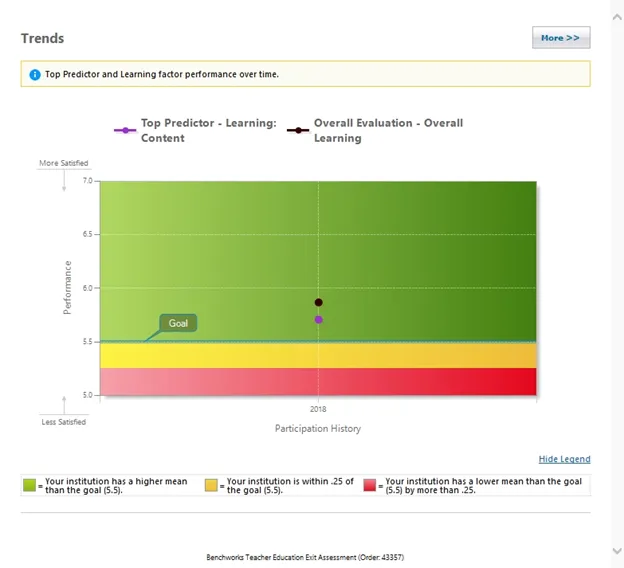
Learning: Content and Overall Evaluation have exceeded the goals
Top Predictor and Learning factor compared to external benchmarks
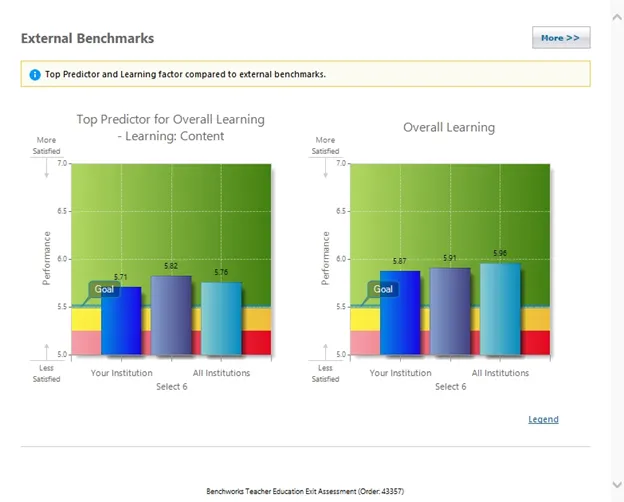
We have reached our goals for Learning: Content and Overall Learning and we are exploring ways to improve in this area.
Population Codes
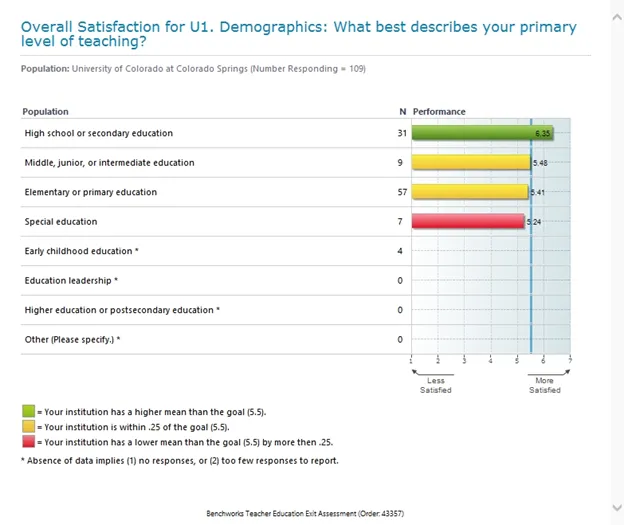
The results show that we need to explore ways to improve our performance in Special Education, Elementary or Primary Education
Profile by Satisfaction
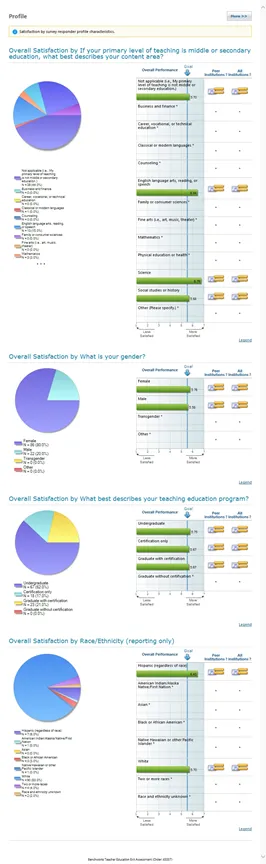
Our university has a higher mean than the goal 5.5 for overall satisfaction when level of teaching is middle or secondary education. There is no statistical difference between our scores and our peer 6 institutions (Old Dominion University, University of Missouri-St. Louis, SUNY at Old Westbury, University of Tennessee at Martin, University of Kansas and University of Wisconsin-Stout).
Program Effectiveness
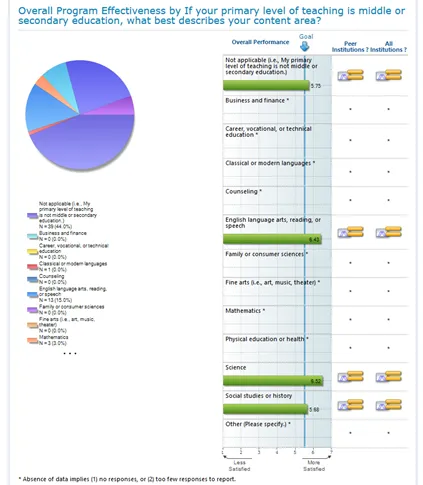
Our university has a higher mean than the goal 5.5 for program effectiveness where primary level of teaching is middle or secondary education. There is no statistical difference between our scores and our peer 6 institutions (Old Dominion University, University of Missouri-St. Louis, SUNY at Old Westbury, University of Tennessee at Martin, University of Kansas and University of Wisconsin-Stout).
Standards
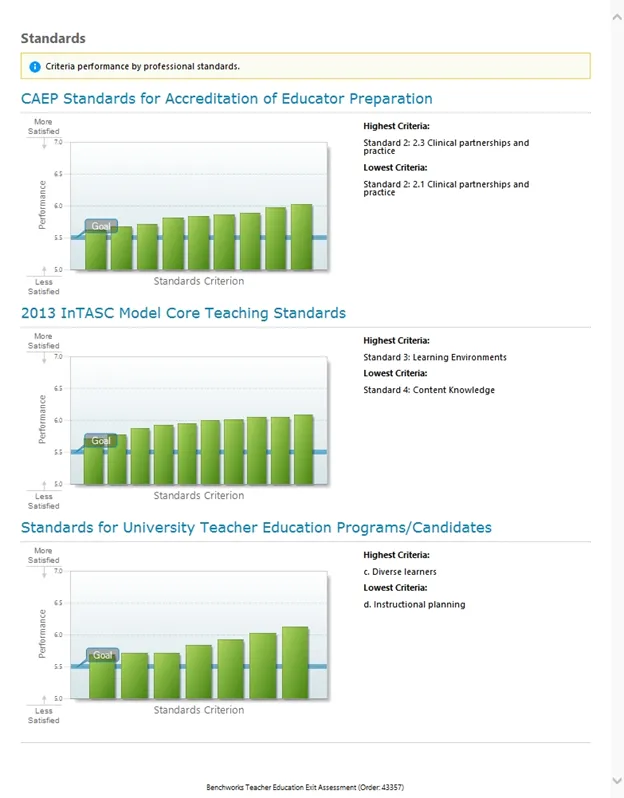
We have exceeded the set goals according to various standards.